StatViz is a simple program to help visualize the way visitors use your web site. This is sometimes called clickstream or path analysis. Unlike traditional web statistics, the output of StatViz is a graph. The file format of the graph file is DOT. These files can be visualized using GraphViz.
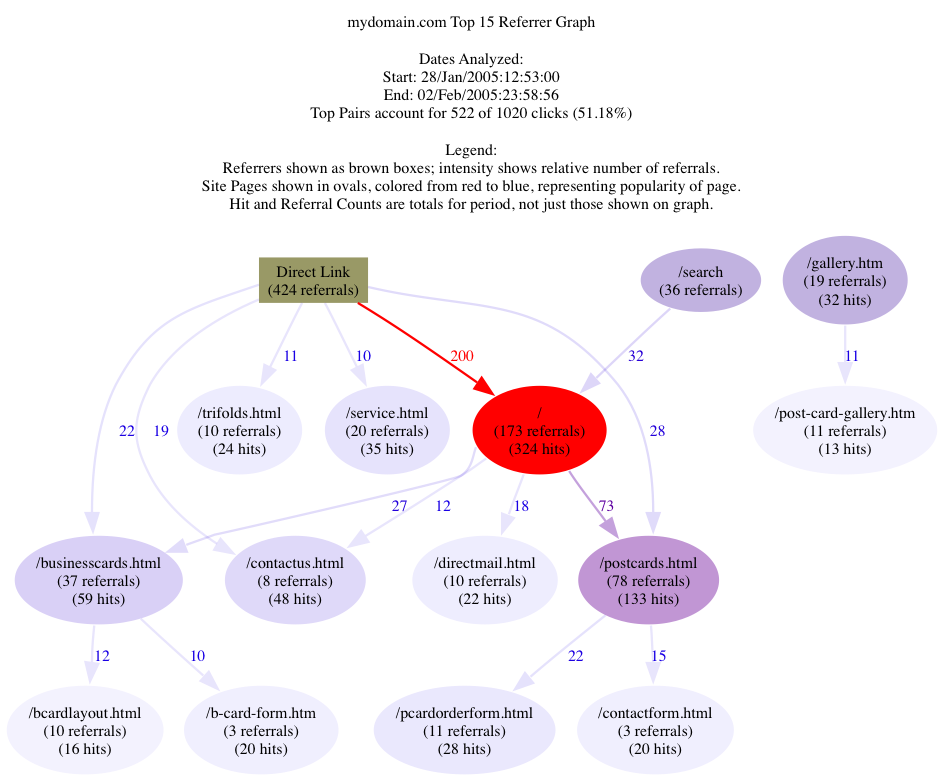
StatViz analyzes the log by creating a histogram of referrer->hit "pairs". The most popular of these pairs are then expressed as a graph. The graph is colorized and labelled to aid in interpretation.
StatViz "pairs" graph explained: in a nutshell, run the program, and look at the output. The stuff that catches your eye is how most people are moving to and through your site.
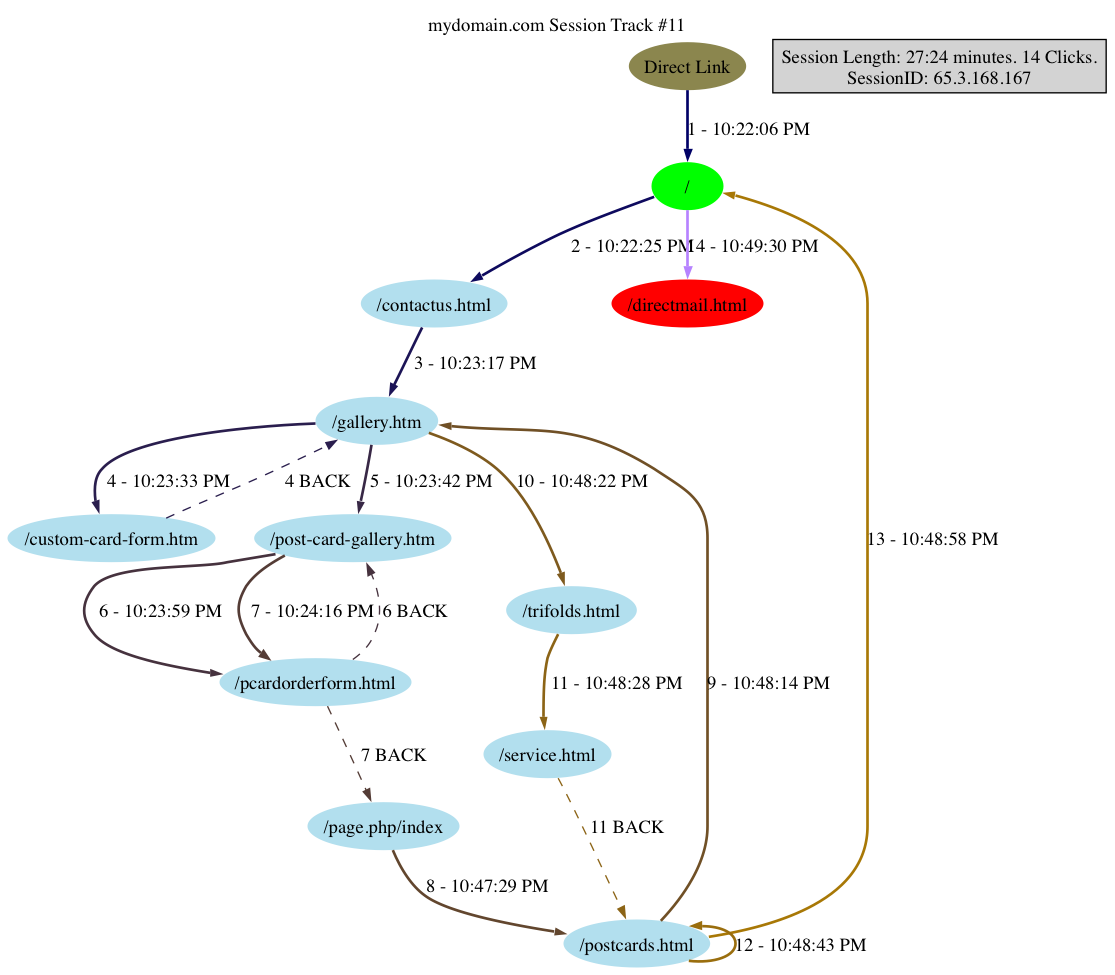
StatViz keeps track of the movements of each individual session in the logfile. The way the session is determined is configurable. By default it now simply uses the IP address. However, you can easily configure StatViz to use a different column as the "unique session ID", for instance from mod_usertrack or a custom session id logged via the Apache notes mechanism. The session track reporter will graph the exact clickstream for the longest (by clicks not time) sessions in the log. This will result in several graphs, and is designed to give a good sampling of how visitors move around the site. If the "Pairs" report above is the 50,000 foot view, this is the on-the-streets view.
The individual session tracks allow you to really understand how people successfully or unsuccessfully navigate through your site. Studying them is a great way to understand how you could better present information on your site to make your visitors get what they want more efficiently.
StatViz "session tracks" graph explained:
StatViz can actually show you these reports LIVE... If you configure the logfile to "php://stdin" then StatViz will read the log lines from STDIN. It will then periodically generate reports as the log is processed, thus allowing you to watch your traffic patterns in real-time. I am not sure how useful this is yet, but it's definitely fun!
Setting up live mode is quite simple. Let's say for instance you create a config to analyze your log files normally (offline) and use the following command to process the logs:
statviz.php --config mydomain.conf
To switch to live view, simply do the following:
tail -f /path/to/mylogfile.log | statviz.php --config mydomain.conf --continuous=20 --logfile=php://stdin
You can even analyze the logfiles remotely with a command like:
ssh -C user@domain.com "tail -f /path/to/mylogfile.log" | statviz.php --config mydomain.conf --continuous=20 --logfile=php://stdin
I am not sure about all of the GraphViz apps, but the one for Mac OS X actually will automatically redraw as soon as the DOT file changes, so in this setup you can just sit back and watch your site traffic live.
StatViz is licensed under the MIT open source license.
Well, that's about all we've got for now! You can DOWNLOAD the software from our SourceForge StatViz Project Page.